| About the Job | |
|---|---|
| At | Foris |
| Role | Engineer Trainee |
| Location | Chile |
| Duration | 7 months August 2012 – February 2013 |
| Website | http://foris.cl/ |
| Summary |
Participated in the development of 3 products of this Artificial Intelligence company.
|
Labor Observatory: In-depth analysis of the Job Market
This was a project that I worked on part-time during the last quarter of 2012. It was a software that was born from a collaboration between Foris and Trabajando.com with the intention of applying data mining and the extensive data analysis techniques developed in Foris to the massive databases handled at Trabajando.com.
Foris is a company that was founded in 2010 by professionals specialized in Analysis and Software Development that provides solutions based on Artificial Intelligence. Their solutions are mostly oriented to the higher education industry, with two very successful products that have bumped them to the position where they stand today: DarwinEd and Deserción. The company’s headquarters are in Santiago, Chile, and it serves over 40 Universities spread across 8 countries.
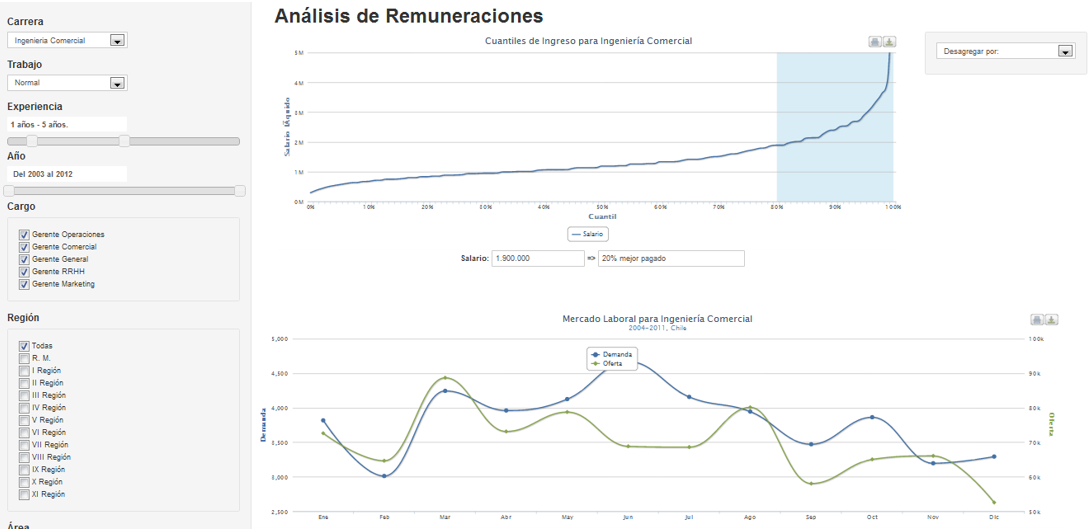
Labor Observatory App Screenshot: Analysis by Degree
The Labor Observatory was a web application that would present a friendly UI to see analysis, statistics and interactive graphs regarding the state of the labor market. It contained analysis such as “Average Earnings per Job Role” which could be dis-aggregated by industries or company sizes for instance. Some other examples of graphs available were:
- Earnings by Degree
- Job Demand vs Job Offer by Degree
- Earnings by Position or Role
- Job Demand vs Job Offer by Position or Role
- Furthermore, these graphs were able to be filtered by:
- Location
- University
- Education level
- Experience years
- Gender
- Industry
- Work regime (full-time, part-time, etc)
- Source data date


The source data that was worked with contained more than 700.000 Job offers posted between 2003 and 2012, for about 70.000 different job positions.
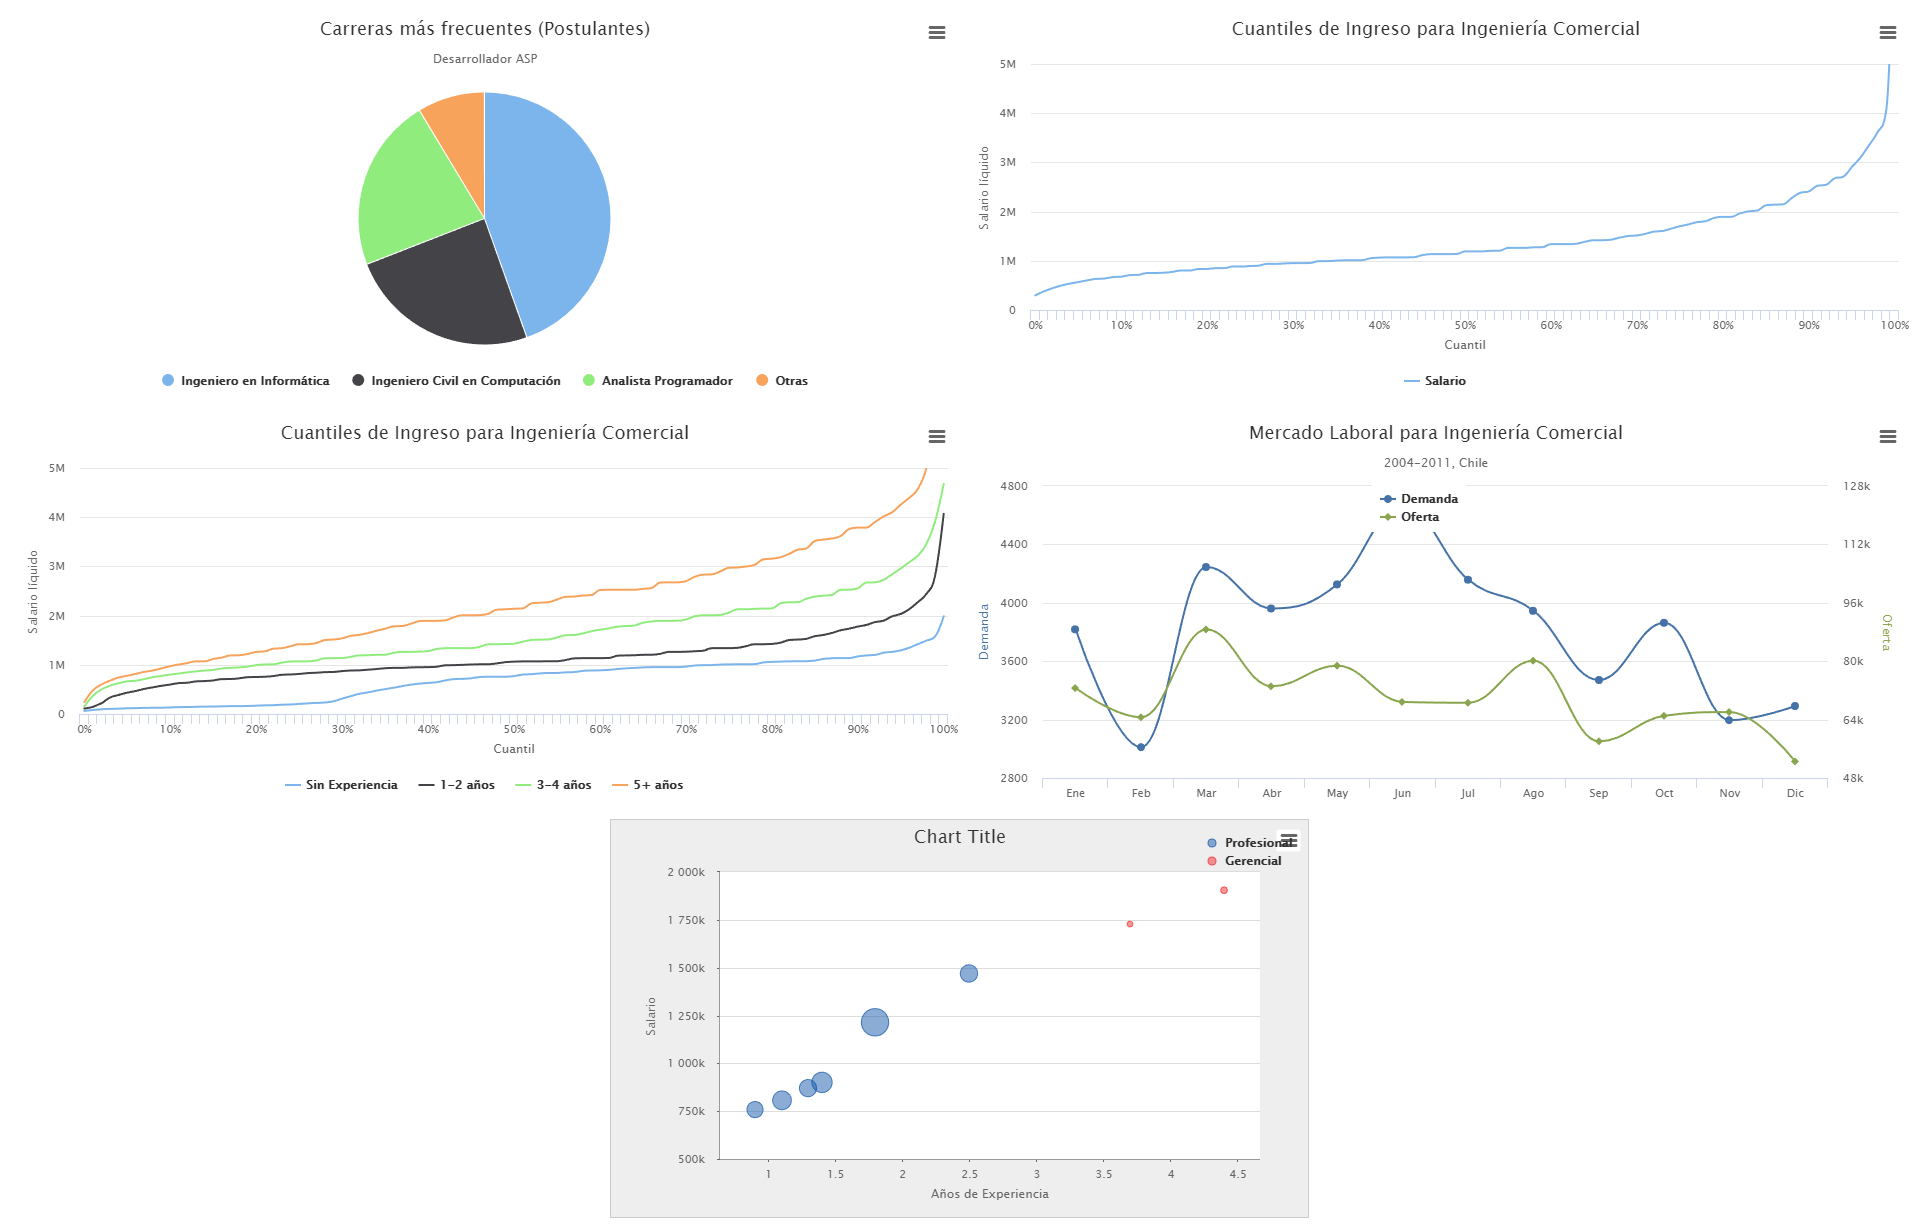
Labor Observatory: Proof of concept graphs
Some of the most exhaustive work that had to be done to process the data was to homologate all the existing roles and positions in the database to create statistics that would make sense and in order to aggregate the data such that enough was found to be statistically significant. In this way, a special module was made that would group together roles such as “Chief of Logistics”, “Chief of Logistics and Distribution” and “Distribution Supervisor” into a single homologous role.
The Experience
On my first day at Foris my manager said to me: “Do you know how to do this?”, I replied: “No”, to which he added: “You have until tomorrow to get it done.” It caused quite the impression on me. I didn’t think I was going to be able to make it, so I felt somewhat upset at such an imperative request. It still surprises me to this day that I was indeed able to finish it by the next day and it taught me a valuable lesson on how a good manager can bring out the best out of you.
For the duration of this project my work place would become the Trabajando.com offices instead of the Foris offices, as was the case for my other 2 co-workers who participated in this development. This allowed me to see up-close the day-to-day operations of a very large internet company, got to know and understand their culture and their inner workings.
This was also one of the first jobs in which I got to explore my love for Front-end development. Here I got to test around and find the best libraries to achieve the look and feel we were looking for while at the same time looking for them to comply with the requirements that we had set up for this project.
Achievements
- Development of Smartphone Applications.
- Development of Analytics Tools.
- First time working in a team under the leadership of a Project Manager.
Frameworks, Software and Technology used
- PHP
- CakePHP
- MySQL
- HTML
- CSS
- Javascript
- jQuery
- Ajax
- REST
- JSON
- Highcharts
- Google Charts
- Subversion (SVN)
- Xampp
- Eclipse IDE
- Analytics
![]()
You must be logged in to post a comment.